Quick introduction to DataDog agent
DataDog is a very powerful monitoring platform. In this article I’m going to show couple of the most frequently used commands for a new developer who has a little experience working with it previously. So let’s go over main things and create a simple configuration for monitoring disk space. Imagine that we have an Ubuntu instance up and running an agent. Visit installation page if don’t have it already or provision your instance with Ansible using Galaxy playbook.
Check the agent is up and running
First we want to make sure that the corresponding service is up and running
1 | $ sudo service datadog-agent status |
In case something went wrong check out system logs as well
1 | $ sudo journalctl -u datadog-agent.service |
Remember, that main configuration file is stored here /etc/datadog-agent/datadog.yaml (default location), so double check it and update settings according to error messages if any.
Now when the service is running we want to check its self-reporting status with
1 | $ sudo datadog-agent status |
Implementing a check
DataDog can monitor dozens of instances at the same time, so the first thing you might want to get is the unique identifier of your current instance. You can do that with a simple command
1 | $ sudo datadog-agent hostname |
Now we know which hostname to use when looking up an instance in your dashboard.
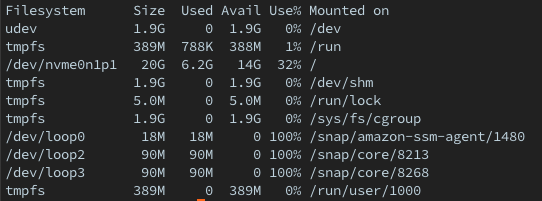
By default agent collects metrics from all the devices available (output from df -h)

So information from your dashboard might be misleading and you would have false alerts even when the disk is not full. To monitor only the device that mounted to the root / we want to replace a default configuration with the following
1 | init_config: |
Save the content to the file /etc/datadog-agent/conf.d/disk.d/conf.yaml. Remember that all the configuration is stored within the subfolders of conf.d directory, so it’s the place where you want to edit existing or to put newly created checks. Do not worry about conf.yaml.default file, it’s not taken into account once file without .default extension is placed within the same directory.
Ok, now we are going to launch our disk check to make sure everything works properly
1 | $ sudo -u dd-agent -- datadog-agent check disk |
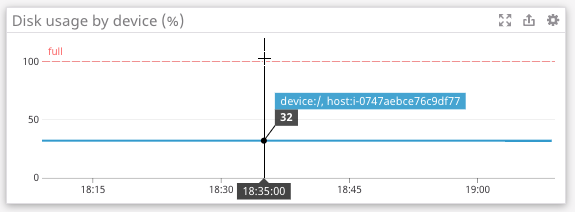
You will receive series information and a short summary, so it’s time to visit a web page for the host’s dashboard

You can see that the value is exactly the same as in Use% column, so now host reports correct metric with proper information. Just make sure that you have monitors for all the critical metrics for your infrastructure and you will be alerted if something goes wrong.
Further debugging
If you still have some issues and need another extra bit of information commands below might help
1 | $ sudo datadog-agent version |
Those will show you current version/commit of the agent running, its health and the validation for the whole configuration is made. If nothing helps at this point as a last resort you might want to send the complete dump of debugging information straight to the DataDog support with
1 | $ sudo datadog-agent flare |
This will create new support case and send all the troubleshooting information needed.
